What Is SAP Datasphere
SAP Datasphere is the next generation of SAP Data Warehouse Cloud, offering a unified platform for data management tasks. It introduces a revolutionary business data fabric architecture that consolidates critical data from various organizations, simplifying decision-making processes. This includes functions such as data integration,cataloging, semantic modeling, and data preparation, handling both SAP and nonSAP data sources. The following sections explain the history of SAP Datasphere and explore its technical architecture.
SAP Datasphere Architecture

SAP Datasphere Interface

Home
The Home page provides access to recent objects and blog updates. Users can customize various display cards, such as the welcome card, and recent accesses in the Data Builder and the Business Builder. The Auto Refresh Data switch enables realtime data updates, and users can adjust card display settings in the customization dialog.
Repository Ex plorer
Basically this feature grants access to all objects in SAP Datasphere, with functionalities that
include searching, filtering, and creating new objects in the SAP Datasphere.
Catalog
This is the centralized place for discovering, enriching, classifying, and publishing trusted data and analytical assets throughout the enterprise. Handling extensive data volumes is a significant challenge for organizations, necessitating a single source of truth and enabling self-service data usage as part of a successful data strategy.
Data Marketplace
This enables businesses to incorporate third-party analytical data. Providers offer data as products that tenants can utilize in various spaces, whether free or requiring a license, and are available as one-time deliveries or receive regular updates.
Semantic On boarding
This is a central platform for importing semantically rich objects from SAP systems, the content network, the data marketplace for SAP Datasphere, and other marketplaces.
Business Builder
Basically this facilitates the development of business entities, fact models, and consumption
models to present data effectively to analytics clients.
Data Builder
This is a important section in the SAP DataSphere where the creation or importation of tables and views, along with the development of data flows, task chains, analytic models, intelligent lookups, and entity relationship
models.
Data Access Controls
This provides the functionality to define criteria-based privileges, managing access to data in views and business layer objects.
Data Integration Monitor
The data integration monitor allows for managing data replication in remote tables, monitoring data flows and task chains, adding and overseeing persisted views, and tracking queries to connected data sources.
Connections
This section enables connections to various data sources in SAP Datasphere, includingcloud, on-premise, SAP, non-SAP, and partner tools,facilitating user access to data for importation, manipulation, and preparation using objects from these sources. Basically this is pure admin sections even if in real-time nobody has access apart from admin.
Space Management
Spaces are secure virtual work environments, each with its own database, serving as the starting point for all data acquisition, preparation, and modeling.
System Monitor
This provides administrators access to a range of monitoring logs and views, as well as the capability to create database analysis users for troubleshooting purposes .
Security
This tools for user creation and modification, role assignment to ensure access rights and data security, and activity logging for changes in system configuration. Again this is the admin area in real-time.
Transport
This includes tools for packaging and adding objects from spaces for transfer to other tenants, as well as exporting and importing objects between spaces.
Data Sharing Cockpit
This serves as the platform for data providers to present data products to the data marketplace users within SAP Datasphere.
System
This tools for configuration and administration and provides technical information about the version of SAP Datasphere in use.
Notifications
This panel is basically for viewing alerts and messages.
Feed back
This section a survey tab for collecting user experiences with SAP Datasphere .
support
Here Users can create support incidents to seek assistance from Product Support.
Help
This is the integration with in-app help feature, providing guidance, procedures, and tutorials,
is accessible via the question mark icon in the upper right-hand corner.
Profile
This section to manage user profile settings and preferences, including user experience customization
and data privacy and task scheduling consent options.
Product Switch
Here we can accessing an organization’s SAP Analytics Cloud tenant .
SAP Data Sphere Connections
SAP Datasphere, formerly known as SAP Data Warehouse Cloud, offers robust connection features that streamline data integration and management. With its ability to connect seamlessly to various data sources, both on-premise and cloud-based, businesses can easily unify disparate data landscapes. SAP Datasphere supports real-time data replication, ensuring that your analytics and business intelligence tools always have access to the most current information. Its user-friendly interface and extensive connectivity options, including native integration with SAP HANA, make it an essential tool for optimizing data workflows and enhancing decision-making processes. Enhance your data strategy with SAP Datasphere’s advanced connection features, designed for scalability, security, and efficiency.

Data Builder
Data Builder in SAP Datasphere is a powerful tool designed to streamline data management and transformation. It allows users to create, model, and refine data sets from various sources, enhancing data quality and accessibility. With its intuitive interface, users can effortlessly visualize data relationships and dependencies, making it easier to derive insights and drive informed decision-making. The Data Builder supports a wide range of data sources, ensuring seamless integration and consistent data governance. In essence, it empowers businesses to harness their data’s full potential, fostering a data-driven culture.

Data Builder

Creating Local Tables by Importing Data from .CSV Files
- Go to Data Builder in the side navigation. Click on Import and then select Import CSV File.
Note : Make sure the .CSV file is no larger than 200 MB and has a .CSV extension. Note that uploads
w ill fail if any cell exceeds 5,000 characters.
2. In the Select Source File dialog (see Figure 4.9), locate the desired .CSV file for uploading.

3. ln the dialog, choose the CSV delimiter and check the Use fi rst row as column header
option.
4. Click Upload to load the .CSV file into SAP Datasphere. The preview page shows data
on the left and column properties on the right.
Data transformations allow you to modify columns, delete rows, and alter cell data
before creating the table. Click Create a Transform to open the transformation types
– Concat enate: To concatenate two or more text columns together.
– Split: To split a text column on a delimiter character.
– Extract: To extract text to a new column.
– Replace: To find and replace data in cells.
– Change: To change the case of a text column.
– Filter: To filter and delete rows.

5. Use the Undo and Redo buttons to manage transformations.
6. After applying the transformations, select Deploy to open the Deploy Table dialog.
7. Specify the Business Name and Technical Name, and then click Deploy to create and
deploy the table with imported data.
8. You will be returned to the Data Builder start page and get a notification once the
deployment is complete.
Creating a Transformation Flow in SAP Datasphere
A transformation flow loads data from one or more source tables, applies transformations
like joins and unions, and produces output in a specified target table. This includes loading a complete dataset or specific delta changes, including deleted records, from a source table to a target table.
Two crucial steps are involved to create transformation flow:
1. Creating a view transform:
The first step employs the View Transform operator, combining and transforming data from specified source tables using SQL syntax. This process involves tasks such as dragging and dropping source tables from the repository, joining them, and utilizing operators for column manipulation, data filtering, or aggregation.
2. Integrating the target table :
Next, integrate a target table into the flow, linking columns from the view transform to this target table.
This is the step-by-step process of creating a view transform:
1. As shown earlier in Figure 4.2 , click Data Builder in the side navigation area and select New Transformation Flow to open the New Transformation Flow screen.
2. Use the View Transform and Target operators, shown in Figure 4.17 0 and 8 , to load data from source tables and transform data.

3. Create a new view transform by clicking the Define View Transform button . The system displays the View Transform Edit You can also choose Create New Table here, which we’ll discuss in later steps.
4. Drag source tables (e.g., Sales Order Items Table and Sales Order Ta ble} from the
repository and drop them onto the View Transform Editor to create necessary transformations
.

5. Click a node on the View Transform Editor to access tools for creating operators and performing actions.

6. Apply necessary transformations and click the Back button to return to the Transformation
Flow Editor.
To add or create a target table, follow these steps:
1. Incorporate a target table into the transformation flow using one of the following
methods:
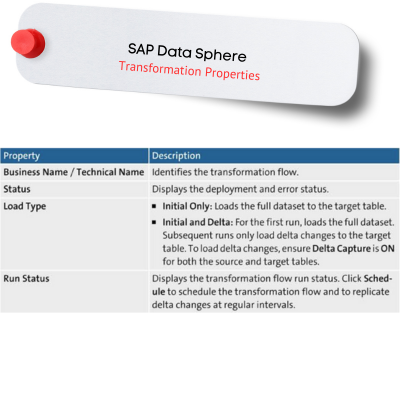
Click the Create New Table button, as shown . The target table becomes part of the transformation flow. Enter a Business Name and a Technical Name for the target table in the Properties panel.
– Drag an existing table (e.g., TF _Sales_ Analysis) from the repository and drop it onto the target node.

click on the target node to display its properties in the side panel and review the properties in the General section.

provides an overview of the target table properties in the General section.

3. In the Mappings section, when connecting any operator to the target table, columns with matching names and compatible data types are automatically mapped.
4. To remove a mapping, select it and click Delete. For clearing all mappings, choose Remove all Mappings. Click Auto Map to rerun automapping based on names and data types.
5. Select the Details button to reveal the Transformation Flow Properties panel. In the General and Run Status sections

6. Click Save , and then click Deploy ) to prepare the transformation
flow for execution. Finally, click Run O to start the transformation flow.
Creating a Data Flows in SAP Datasphere
Data.flows play a crucial role in managing the extraction, transformation, and loading (ETL) of data. Unlike graphical views, which transform data temporarily without persistence, data flows excel in both transforming and persisting changes in data structures. Here we will explore data flows and their operator types, as well as learn about creating data flows and configuring their schedules.
Data Flow Operators
First, let’s explore the data flow transformation operators
1 Join
Combines two datasets into a single output based on specified conditions (INNER,LEFT_ OUTER, RIGHT_ OUTER).
2) Union
Merges two datasets with the same schema; Union All includes or excludes duplicate
records based on the toggle setting.
3) Projection
Adds, removes, reorders, or renames columns in a dataset.
4) Aggregation
Performs calculations like SUM, AVG, MIN, MAX, or COUNT on datasets.
5) Script
Transforms incoming data using a Python script, sending the structured output to
the next step in the process.
6) Add Table
Inserting a target table enables data writing. Note that there is a restriction of having only one target table in a data flow, and using a local table with delta capture is not permitted.

Creating a data flow is user-friendly through a graphical interface, allowing modelers to intuitively design the flow by dragging and dropping sources, joining datasets, and integrating Python scripting. This visual representation simplifies the int ricate process of moving and transforming data.
A key feature in data flows is the script operator. This tool allows users to transformdata using Python scripts. It takes data from previous steps, applies transformationlogic, and sends structured output to the next step.
Creating Data Flows
1. Create a new data flow :
click Data Builder in the side navigation area and
click New Data Flow. Explore the options available in the data flow toolbar.


2. Add a source object
Drag and drop the objects (e.g., Sales Orders table, Sales Order Item table) from the Source Browser panel on the left side.
3. Create a join operator
Click and drag the Join tool onto the canvas to create a join for the source objects.View its properties in the side panel and complete the details in the Gene ral section,including the Label and Type.Edit mappings in the Join Definition section by clicking on the Edit icon or use Automapto match column names.For manual mapping, drag a left column onto a right column. To delete a mapping,
select it and click the Delete icon.In Advanced Properties, edit join optimization by clicking the Edit icon. ChooseManual optimization only when necessary.
4. Create a union operator
Drag the Union tool to the desired location on the canvas. Connect the join node to the union by dragging and dropping the port on its right onto the union operator.Repeat the same process for the second source node (e.g., TF SALES_ ANALYSIS}.Click the union operator and complete the details in the General section, including the Label and using the Union All toggle to include or exclude duplicate records. In the Mappings section, review and modify union mappings. Drag columns from the source to the union columns to create or adjust mappings. Delete mappings by selecting and clicking the Delete icon.
5. Create a projection operator
Drag the Projection tool onto the canvas. Connect the source node by dragging the port on its right to the projection operator, creating a flov1.Click the projection operator, name it in the General section, and in the Columns section, specify column mappings.Hover over a column and click to change the name, remove the column, or duplicate it.To create a calculated column in the Properties panel of the Projection Operator,select the + icon in the Columns section. Then, in the Expression field, define the
expression for the calculated column.
6. Create an aggregation
Drag the Aggregation tool to on the canvas. Connect the projection operator byclicking and dragging the port on its right to the aggregation operator, creating a flow.
Click the aggregation operator to open its properties in the side panel. Complete
the details in the General section.
In the Columns section, review the output columns and set aggregations by hovering over a column, then click the menu icon to change its aggregation. Options include:
– [no value] – Default. Use as a grouping column.
– SUM – Calculate the total value of all ro”llvs (numeric columns only).
– AVG – Calculate the average value of all rows (numeric columns only).
– MIN – Calculate the minimum value of all rows (numeric columns only).
– MAX – Calculate the maximum value of all rows (numeric columns only).
– COUNT – Calculate the number of distinct values.
7. Create a script operator
Drag the Script operator on to the canvas. Connect the source node by dragging the
port on its right to the script operator, creating a flow. Click the Script operator to open its properties in the side panel. In the General section,enter a name for the operator in the Label field. In the Script section, input Python script for data transformation.
8. Add or create a target table
Click Add Table and drag it to the canvas to create a new target table (the New label indicates it’s newly added), or drag an existing table from the Source Browser to the canvas and click the floating Target button.Connect the last operator’s port to the target table to create a flow.

Manage mappings in the Mappings section, and use Auto Map for automatic map pings.
Click Create and Deploy Table to deploy the new target table to the repository. (This
step is not necessary for an existing table.) Click Save to preserve the current state and Save As to create a local copy, entering new names. Deploy the data flow by clicking the Deploy icon. To run the data flow,click Run.
Data Flow Schedule
Go to Schedule in the Run Status section.
The options available in the Run Status
• Create Schedule: Set up a recurring schedule to execute the data flow asynchronously
and periodically based on the defined settings.
• Edit Schedule: Modify the schedule specifications or change the owner as required.
• Delete Schedule: Remove the schedule when necessary.