SAP Analytics Cloud (SAC)
What is SAP Analytics Cloud :-
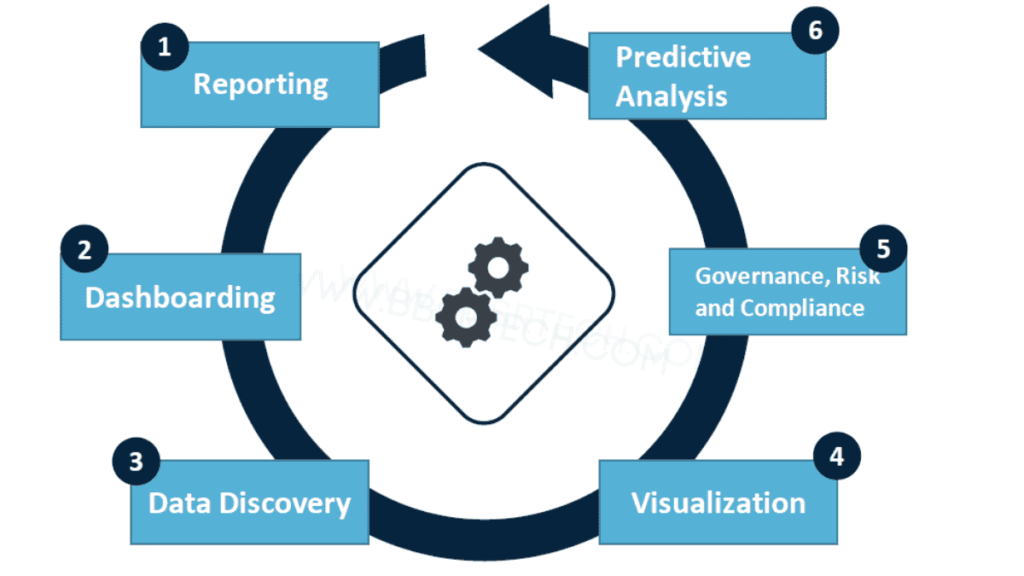
It is a cloud-based Business Intelligence (BI) platform that uses data from models to create reports and visualize data for business planning and decision making. It can be used for the following:
SAC Tool – Benefits
- Single platform to share, collaborate and plan in real-time .
- User can perform operations on data without downloading reports.
- Report generation can be automated.
SAP Analytics Cloud Key Features
Is a data source from which desired data can be pulled to create single or multiple stories.
Is a report created from data captured from a single or multiple models and comprises of flat reports or dashboards or both.
Is a tabular representation of data presented in a story.
Is a graphical representation of a flat report, customized using widgets to give an overview of the story.
Is a graphical element like graph, chart, timeline, heatmap etc., used in a dashboard.
Is the data stored in the models.
Is a field in the data source or model, which stores a particular type of data, for example; company code, item description, G/L account etc.
Sap Analytics Cloud Tool – Basic Navigation
SAP Analytics Cloud Introduction
1.To access a story, open the Files menu via the main menu.
2.Optionally, you can add objects of stories directly to your personalized home screen by using the Pin to Home feature, if you prefer direct access to selected charts, tables, etc.
3.Select an object in your story and click the Pin to Home button on the panel to pin the object to your home page.
Story Setup
Once you’ve opened your story, you have various options to customize, filter or export data visualizations.
Measure and Dimension Input Controls help you to filter data, compare figures, and explore relationships. When you view a story, you may want certain information to be readily accessible, but not necessarily always displayed. Input controls allow you to switch between the dimensions and measures you like to see in one or more story objects.
Sorting
Sorting helps you to arrange values in charts and tables in order to enhance your story.
Use the function in the menu field (left mouse button in the tiles) to arrange the values of a diagram alphabetically, in ascending or descending order, or according to a standard sequence (for example, fixed key in a query)
You can use the Advanced Sorting function to specify customized sorting including other measures.
Top N Ranking
The Top N ranking feature allows you to identify top and flop contributors in your story objects.
- Within the tool, tops and flops of a chart can be displayed by clicking the trophy icon . You can use fixed settings (Top 5 and Bottom 5 are preset) or define individual rankings.
- Top N Options allows you to define individual values such as the Top 10.
Full screen Mode
By switching into Full screen mode you can view and analyze charts and tables in a more convenient way.
- To enlarge the respective charts or tables, click the full screen symbol in the menu field of the respective tiles.
- To reduce the size of the object again or to restore them to their original size, click the Restore Down icon that appears on the full screen.
Data Explorer
The data Explorer function in SAP for Analytics Cloud is an advanced analysis function that can be accessed directly from your stories. It must be activated by the developer for every single chart where it should be available.
- The Explorer mode can be accessed from the menu field in your charts and tables or via the subtitle if available
- The upper section contains dimensions and measures that can be used; used measures are marked in blue.
- Additional measures and dimensions can be inserted for further analyses.
Visualizations
The Explorer allows you to display the selected data with the help of various object types. In addition to numerous visual representations, the table form can be selected. This allows to see the used data of the chart in a raw format.
Linked Analysis
Linked analysis is useful when you want to focus on a particular area of your business and see how other charts (based on different measures and dimensions) are affected.
1.Select a bar of the chart, in this example we choose the values for a source location.
2.As the charts are linked, selecting a data point in the left chart results in setting a temporary filter for the other chart (source location ID). Only the destination location data for the selected source location is shown.
3.When you unselect the source location in the left chart or switch to another source location, the filter in the right chart will always be affected.
Collaboration and Content Sharing
Collaborating via Story Sharing
In general, users can share a story in two ways: internally and externally.
To share a story internally, the user selects the ‘Share Story’ icon and chooses who to share the story with.
Sharing a story with members in an organization who use SAP Analytics Cloud allows them to use the dynamic features such as hierarchical drill down, input controls, and linked dimensions.
To share a story externally, the user selects the “Save As File” option and selects the file type as PDF.
This is the way to share a story to external agents who may not have SAC in SAP. Note that sharing the story in this way will remove all the dynamic functionality.
Collaborating via Discussions
To create a discussion, simply select the discussion icon, choose one or more people you wish to collaborate with, and then start a conversation. You can write messages, add attachments, and link to other stories in SAP Analytics Cloud.
1.Select the Discussion icon on the right upper side of the screen and create a new discussion by clicking the + icon.
2.A new discussion has been created. Click the + icon next to Invite Participants bar to invite colleagues and choose them from the list.
You can now communicate with other SAP Analytics Cloud users via discussion.
Collaborating via Tasks
Tasks can be assigned to one or more collaborator. When assigning a task to someone, a final reviewer can be included, related content attached, and a deadline and reminder can be set. The collaborators will receive an email notification with a link to the story. When a deadline is set, an event will be added to the calendar of all collaborators.
1.Open the Calendar.
2.Create a new task.
3.Assign assignees & reviewer, attach content, additional information, reminder in the Builder panel of the task.
4.Activate the task. This action will send notifications to all people involved in this task and it will be visible in their calendar.
Difference between SAP DWC vs SAC
SAP Data Warehouse Cloud (DWC)
- Data Management: DWC is designed for data management, integration, and storage. It provides a centralized repository for all your data, enabling you to manage and govern your data effectively.
- Use Cases: Ideal for data warehousing, data lakes, and big data analytics.
SAP Analytics Cloud (SAC)
- Analytics and Reporting: SAC is focused on analytics, reporting, and planning. It allows users to create interactive dashboards, reports, and predictive analytics.
- Use Cases: Ideal for business intelligence, financial planning, and predictive analytics.
Key Features
SAP Data Warehouse Cloud (DWC)
- Data Integration: Supports various data sources including SAP and non-SAP systems.
- Data Storage: Offers scalable storage solutions for large datasets.
- Data Governance: Provides robust data governance features to ensure data quality and compliance.
- SQL Access: Allows SQL access for querying and analyzing data.
- Machine Learning: Integrates with machine learning capabilities for advanced analytics.
SAP Analytics Cloud (SAC):
- Interactive Dashboards: Enables creation of interactive dashboards with various visualization tools.
- Predictive Analytics: Offers predictive analytics capabilities using machine learning algorithms.
- Planning and Forecasting: Supports financial planning and forecasting with advanced modeling capabilities.
- Collaboration: Facilitates collaboration among users through shared stories and reports.
- Mobile Access: Provides mobile access for on-the-go analytics.
SAP SAC Planning
SAC Planning is a module within SAP Analytics Cloud that allows users to create and manage financial plans, budgets, and forecasts. It integrates with other SAP systems and provides advanced analytics capabilities to support decision-making processes.
-
Financial Planning:
- Budgeting: Create detailed budgets across various departments and levels.
- Forecasting: Generate forecasts based on historical data and predictive analytics.
- Rolling Forecasts: Update forecasts regularly to reflect changing business conditions.
-
Advanced Analytics:
- Predictive Analytics: Use machine learning algorithms to predict future trends.
- Simulation: Run what-if scenarios to analyze different business outcomes.
- Data Visualization: Create interactive dashboards to visualize planning data.
-
Collaboration:
- Workspaces: Collaborative workspaces for teams to work on plans together.
- Commenting and Approval: Commenting and approval processes to ensure transparency and control.
-
Integration:
- SAP Systems Integration: Seamless integration with other SAP systems like SAP S/4HANA, SAP BW/4HANA, etc.
- Third-Party Systems Integration: Supports integration with third-party systems via APIs and connectors.
-
Security and Governance:
- Role-Based Access Control: Ensure that only authorized users can access and modify planning data.
- Auditing: Track changes and activities for compliance and auditing purposes.
Benefits of SAC Planning
- Improved Accuracy:
- Advanced analytics and predictive capabilities help improve the accuracy of financial plans.
- Enhanced Collaboration:
- Collaborative workspaces facilitate better teamwork among different departments.
- Real-Time Insights:
- Real-time data integration provides up-to-date insights for timely decision-making.
- Scalability:
- Cloud-based solution that scales with your organization’s needs.